
a featured image for a blog article: how to read a servo motor torque speed curve

A servo motor torque-speed curve is more than a plot of maximum torque and maximum speed. Its shape shows how the motor and amplifier behave across the operating range—and where electrical limits begin to affect available torque.

When comparing servo systems, the most useful information often comes from looking at how the curve changes with speed, not just the endpoints.

1. Identify the Continuous and Intermittent Operating Regions

Servo motor torque-speed curves generally show two operating regions:

  • Continuous operation: where the motor can operate without exceeding its thermal limits
  • Intermittent operation: where higher torque is available for short periods such as acceleration and deceleration
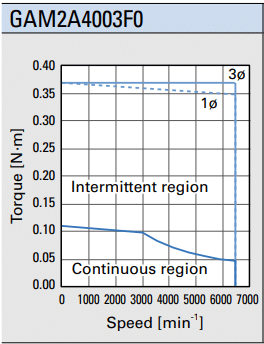
 

a speed torque graph of SANMOTION G motor
Speed torque characteristics of a SANMOTION G servo motor


The useful part of the graph is not simply identifying which region is which. It is understanding where the boundary begins to change and why.

2. Look at How the Curve Changes with Speed

At lower speeds, servo motor torque is primarily limited by the amount of current that the motor and amplifier can handle.

Because motor torque is closely related to current, the system can maintain relatively high torque through this region.

As rotational speed increases, however, back electromotive force (back EMF) also increases. The amplifier must apply progressively more voltage to continue driving the required motor current.

Eventually, the system approaches its available voltage limit. At that point, current becomes more difficult to maintain and available torque begins to decrease.

In practical terms, the operating condition transitions from primarily:

Current limited → Voltage limited

SANYO DENKI discusses this relationship in the whitepaper: “Development of SANMOTION G.” Improvements in amplifier voltage utilization increased the voltage available to the motor during high-speed operation, helping increase high-speed torque and expand the usable output range.

This is why maximum speed alone is not a sufficient measure of high-speed servo performance. Two servo systems may reach similar speeds while providing significantly different torque at those speeds.

It is discussed in the whitepaper: “Development of SANMOTION G AC Servo Systems”

3. Pay Attention to the High-Speed Region

For applications with rapid movement, the high-speed portion of the curve can be more important than rated torque alone.

Two motors with similar rated output may behave differently because of:

  • Motor winding characteristics
  • Back EMF
  • Amplifier voltage utilization
  • Amplifier current capability

One system may maintain torque farther into the high-speed range, while another begins losing torque earlier.

That difference can affect:

  • Acceleration time
  • Deceleration time
  • Maximum usable speed under load
  • Machine cycle time

This is one reason rated wattage alone can be misleading when comparing servo motors.

4. Consider How Acceleration Moves the Operating Point


The operating point changes throughout the machine cycle.

During acceleration, the motor must generate additional torque to accelerate both the motor inertia and the load inertia. Higher total inertia or faster acceleration therefore increases the required torque.
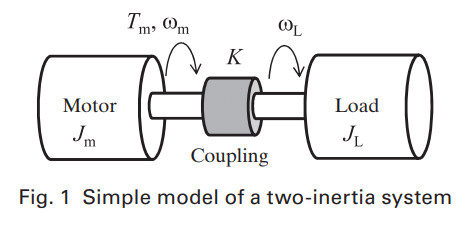
a diagram showing a two inertia system of a motor

An axis that operates well inside the continuous region during constant-speed operation may move significantly upward on the torque-speed curve during acceleration.

It is discussed in the whitepaper: “Development of the SANMOTION R1 Series Small-Capacity Low Inertia AC Servo Motors”

5. Read the Curve Across the Motion Cycle

A typical positioning cycle may look like:

Diagram showing Motion Positioning Cycle: Accelerate → Constant Speed → Decelerate → Stop → Repeat


Instead of checking only one operating point, compare the torque-speed requirements at the important stages of the cycle:

  • Acceleration: higher torque may be required while speed is increasing
  • Constant speed: torque may decrease once the load reaches the required speed
  • Deceleration: torque increases again as the motor slows the load
  • Stop: the axis prepares for the next cycle or holds position

The key is whether each required operating point remains inside the appropriate continuous or intermittent region.

This becomes especially important when an axis requires both high speed and high acceleration, because those requirements can push the operating point toward the portion of the curve where available torque is already decreasing.


6. Compare More Than Rated Torque and Maximum Speed

When comparing servo torque-speed curves, look at several characteristics together:

  • Where high-speed torque begins to decrease
    A curve that maintains torque farther into the high-speed range may provide more usable performance for fast-moving axes.
  • How much intermittent torque is available at the required speed
    Peak torque at low speed is less meaningful if the application needs higher torque at a much higher rotational speed.
  • The relationship between continuous and intermittent operating regions
    The intermittent region can support short periods of higher torque, but repeated operation still needs to remain within the motor’s allowable thermal conditions.
  • The motor and amplifier combination
    The torque-speed curve reflects the performance of the servo system, not simply the motor. Amplifier voltage and current capability can materially affect the usable operating range.

The Torque-Speed Curve Is a Performance Map

In summary, the most useful way to read a servo motor torque-speed curve is as a performance map.

It shows:

  • Where the system can maintain torque
  • Where electrical limits begin to reduce available torque
  • How much torque remains available at higher speeds
  • Whether acceleration, constant-speed, and deceleration operating points fit within the usable range

That provides a more complete picture of servo performance than comparing rated wattage, peak torque, or maximum speed individually.

For complete motor sizing—including inertia, RMS torque, duty cycle, and thermal evaluation—use the detailed motor sizing procedure.


This article is part of SANYO DENKI AMERICA’s motion control engineering knowledge base, sharing practical insights used in real-world servo and motion control applications.

Request A Consultation

Request a consultation for your customization needs. Our team will be in contact with you soon to provide further information and answer any questions you may have.